This week felt like a whole new beginning to AP Calc. Since we finished exams last week, we have started learning about optimization. I like having the opportunity to switch up who is in my class and learn from Mrs. Krauss, but I also really miss having Mr. Cresswell in class. Although I thought the change may be a little challenging for me, I think it has been much easier because many of the basics of optimization are skills we learned last tri, like finding derivatives, critical points, and extrema.
On Tuesday when we began the lesson, we learned a 6-step strategy for optimization:
1. Understand
2. Develop a model (include pictures)
3. Graph the function
4. Find the critical points
5. Solve the model
6. Interpret the solution
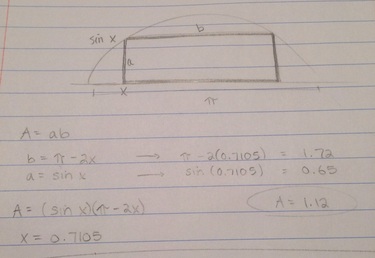
One of the examples in the notes that best helped me to understand optimization was the one in which we needed to determine the maximum area of a rectangle under a sine curve. We began by thinking about what the problem was asking and drawing a diagram. We knew that the area of the rectangle would be equal to side a times side b. We also knew that the length of one sine curve was pi, or half of the period of a sine function. Our diagram also showed us that if the edge of the rectangle occurred at point x, the height of the triangle would be sin x. We used this information to form equations that together would make up a function of area of the variable x, or A= (sin x)(pi - 2x). We graphed and evaluated this function in order to determine the maximum. We found that the x-value of the maximum/a critical point was 0.7105. When we plug this value into the equations we created for the length of each side, we discover that the side lengths are 1.72 and 0.65, and the maximum area (a*b) is 1.12.
When working on my homework, I realized that some problems can be tough when it is not easy to see the maximums or minimums when the function is first graphed. In these cases, we can use the derivative to find the critical points, or where the extrema occur. Overall, I think that I have a pretty good understanding of optimization, but I think I will feel better after practicing more problems in the assignments this weekend!
On Tuesday when we began the lesson, we learned a 6-step strategy for optimization:
1. Understand
2. Develop a model (include pictures)
3. Graph the function
4. Find the critical points
5. Solve the model
6. Interpret the solution
One of the examples in the notes that best helped me to understand optimization was the one in which we needed to determine the maximum area of a rectangle under a sine curve. We began by thinking about what the problem was asking and drawing a diagram. We knew that the area of the rectangle would be equal to side a times side b. We also knew that the length of one sine curve was pi, or half of the period of a sine function. Our diagram also showed us that if the edge of the rectangle occurred at point x, the height of the triangle would be sin x. We used this information to form equations that together would make up a function of area of the variable x, or A= (sin x)(pi - 2x). We graphed and evaluated this function in order to determine the maximum. We found that the x-value of the maximum/a critical point was 0.7105. When we plug this value into the equations we created for the length of each side, we discover that the side lengths are 1.72 and 0.65, and the maximum area (a*b) is 1.12.
When working on my homework, I realized that some problems can be tough when it is not easy to see the maximums or minimums when the function is first graphed. In these cases, we can use the derivative to find the critical points, or where the extrema occur. Overall, I think that I have a pretty good understanding of optimization, but I think I will feel better after practicing more problems in the assignments this weekend!
 RSS Feed