I have always wondered what derivatives are because they are always mentioned when I ask someone about their experience taking Calculus. Now that we have started studying them, I am excited because although the concept was challenging at first, I think it is very interesting.
The most helpful activity for me that we worked on this week was Lab 6. I found it to be a little challenging in the beginning, but as I worked through it using Desmos, I was able to see a pattern and visualize the relationship between the graph of a function and the graph of its derivative. I found question #4 to be especially helpful as it asked us to make a conjecture relating intervals on which the function is rising, intervals on which it is falling, minimums, and maximums to properties of the graph of its derivative.
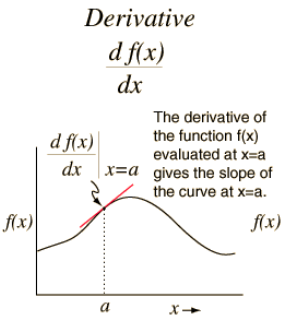
My conjecture was: The graph of a function’s derivative is above the x-axis when the graph of the function is rising and below the x-axis when the graph of the function is falling. The high and low points of the graph of the function are equal to the zeros of the graph of its derivative.
Because the derivative represents the slope of the function at any point, the derivative is positive (above the x-axis) when the slope of the function is positive (function is rising), and negative (below the x-axis) when the slope of the function is negative (function is falling). The zeros of the graph of the derivative are equal to the minimum and maximum points of the function because these are the points when the slope of the function is zero.
Writing this statement in question #4 required that I fully understood what was being shown in the lab. It made me think deeper about how I came to that conclusion. I believe that looking at the graphs, analyzing relationships between them, and forming a conjecture in my own words helped me to truly learn and understand the concept rather than just being given the relationships and rules and being asked to memorize them. By completing this lab, I have improved in my ability to identify what the graph of a function's derivative should look like. I feel that I have a much better understanding of the relationship between functions and their derivatives and I know that I can look back at the examples in Lab 6 if I ever need help.
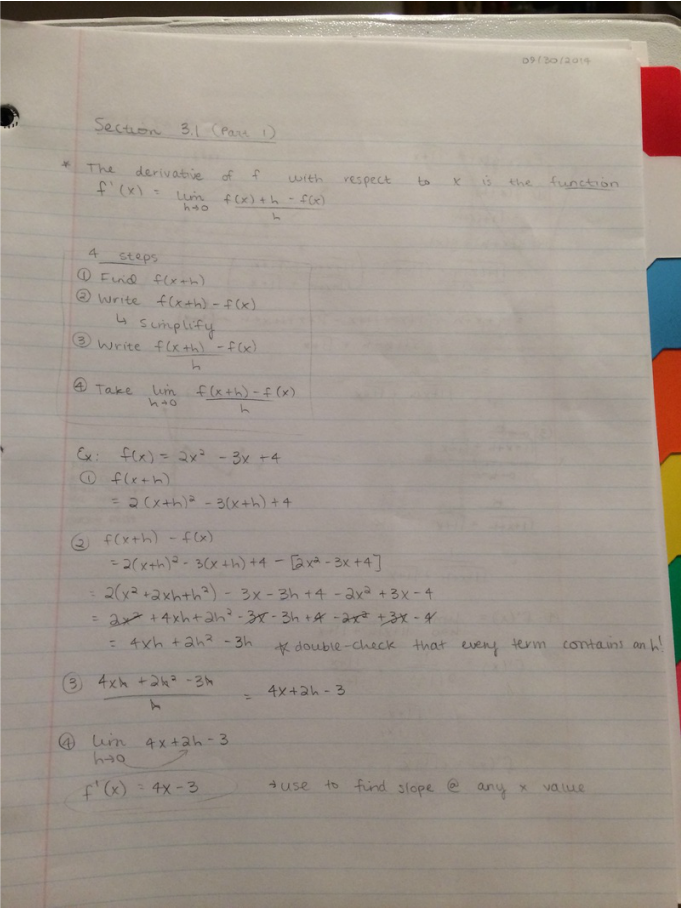
Tuesday's lesson about finding derivative equations of functions also helped a lot! I found it really cool that the work we did with the difference quotient last year is coming in to play and making sense now. The 4 steps that we learned in the lesson as well as the examples that we did in class have been a big help to me in finding equations for derivatives.
The most helpful activity for me that we worked on this week was Lab 6. I found it to be a little challenging in the beginning, but as I worked through it using Desmos, I was able to see a pattern and visualize the relationship between the graph of a function and the graph of its derivative. I found question #4 to be especially helpful as it asked us to make a conjecture relating intervals on which the function is rising, intervals on which it is falling, minimums, and maximums to properties of the graph of its derivative.
My conjecture was: The graph of a function’s derivative is above the x-axis when the graph of the function is rising and below the x-axis when the graph of the function is falling. The high and low points of the graph of the function are equal to the zeros of the graph of its derivative.
Because the derivative represents the slope of the function at any point, the derivative is positive (above the x-axis) when the slope of the function is positive (function is rising), and negative (below the x-axis) when the slope of the function is negative (function is falling). The zeros of the graph of the derivative are equal to the minimum and maximum points of the function because these are the points when the slope of the function is zero.
Writing this statement in question #4 required that I fully understood what was being shown in the lab. It made me think deeper about how I came to that conclusion. I believe that looking at the graphs, analyzing relationships between them, and forming a conjecture in my own words helped me to truly learn and understand the concept rather than just being given the relationships and rules and being asked to memorize them. By completing this lab, I have improved in my ability to identify what the graph of a function's derivative should look like. I feel that I have a much better understanding of the relationship between functions and their derivatives and I know that I can look back at the examples in Lab 6 if I ever need help.
Tuesday's lesson about finding derivative equations of functions also helped a lot! I found it really cool that the work we did with the difference quotient last year is coming in to play and making sense now. The 4 steps that we learned in the lesson as well as the examples that we did in class have been a big help to me in finding equations for derivatives.
 RSS Feed